Automated Atlas Annotation for Transgenic Mouse Lines
Ken Sugino (Brandeis University), Yao Cheng (Brandeis University), Sacha Nelson (Brandeis University)
The brain consists of a multitude of cell types that are connected in specific and intricate ways. The elucidation of neuronal cell types and their patterns of connection are critical steps in understanding brain function. However, while cellular phenotypes like morphology, marker expression and electrophysiology have successfully delineated component cell types in some brain regions, the identification of neuronal cell types in many other regions remains a matter of ongoing debate. Recently, transgenic mouse lines that label specific subpopulation of cells are being recognized as useful tools for the identification and investigation of neuronal cell types. Efforts in generating mouse lines for this purpose are underway in various places and a central database serving as a repository of information gained from those mouse lines is already established (http://www.credrivermice.org).
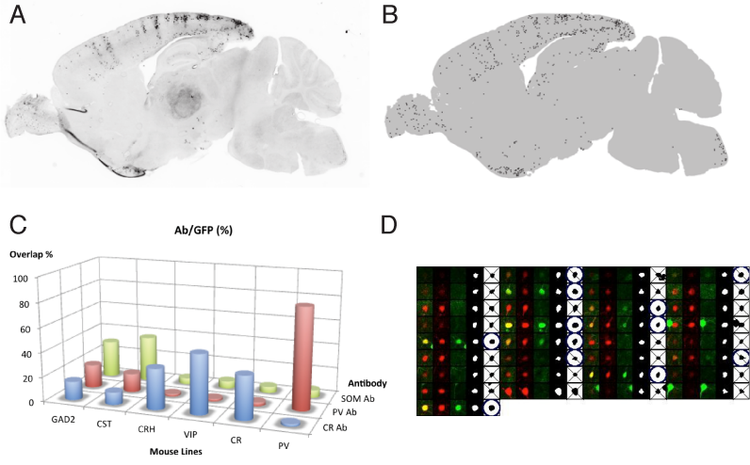
Two of the most useful types of information needed for each cell type identified in a transgenic mouse lines are 1) the anatomical location of the labeled cells , and 2) the expression of previously recognized molecular markers, typically assessed in terms of the degree of overlap between cellular labeling and immunolabeling staining experiments. Those data can be analyzed manually, however, the work required is rather extensive (e.g.20 sections/line x 100 lines x 2 hr/section*person ~ 2 person-years) Hence, automated systems to replace or assist manual analysis are desired.
Our approach for automated assignment of anatomical region consists of three steps: (1) detection of labeled cell bodies in each section, (2) registration of a series of sections from a given mouse line into a standard brain space such as Waxholm space, and (3) mapping the counts of detected cell bodies into anatomical regions assigned in the standard space. For the second problem of marker overlap counting, the cell body detection in one channel (i.e. step 1), is followed by detecting signal from one or more other channel (step 4). We have currently implemented steps (1) and (4), and are collaborating with other groups for realizing steps (2 and 3).


 Latest news for Neuroinformatics 2011
 Follow INCF on Twitter
