BioScholar: A user- centered biocuration and knowledge management system that uses models of experimental design to drive knowledge acquisition and literature mining of neural connectivity data
Marcelo Tallis (Information Sciences Institute / University of Southern California), Cartic Ramakrishnan (Information Sciences Institute / University of Southern California), Thomas Russ (Information Sciences Institute / University of Southern California), Gully Burns (Information Sciences Institute / University of Southern California)
BioScholar uses models of experimental designs to drive knowledge acquisition and representation. These experimental design models usually are common to several experiments reported in the literature. An experimental design model defines an experimental procedure and a set of experimental variables. These variables define the knowledge that needs to be extracted from scientific reports. The experimental design also captures the interdependency among experiment variables and provides the context for interpreting the experiment data. We call this methodology for capturing and representing knowledge Knowledge Engineering from Experimental Design (KEfED) [1]. One important benefit of representing knowledge based on a well-principled and semantically-grounded model is that this knowledge can be taken by an automated reasoning system to derive more general statements that we call interpretations. We show this capability in an application of BioScholar for neural connectivity data. BioScholar represents KEfED data using the Web Ontology Language (OWL) and well established domain ontologies.
The BioScholar system is composed of several subsystems that support many of the activities involved in biocuration. The Digital Library subsystem supports users in managing large collections of articles and citations. The literature mining subsystem, based on SciKnowMine [2], can identify articles concerned with a particular experimental technique (triage) and extract information relevant to the experiment to be described. The KEfED Model Editor provides a user-friendly editor for authoring experiment design models. The Experiment Editor provides a user-friendly spreadsheet-like editor for entering data from a reported experiment. The literature landscape visualization subsystem provides an interactive map for a user to explore the literature landscape around topic models.
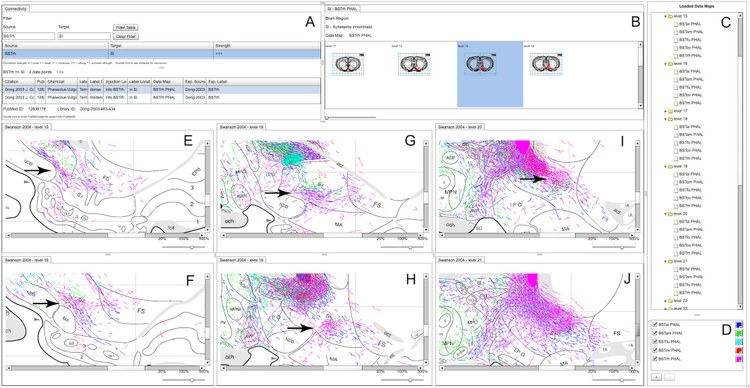
We have applied BioScholar to curate neural connectivity data as a case study. Within this application, we also demonstrated how KEfED-based representations can be exploited by a reasoning system to provide added value to investigators. In this application, a domain specific reasoning subsystem is able to infere connectivity assertions from experimental observations. We have also integrated into this application NeuARt, a digital atlasing subsystem for viewing and analyzing spatial data registered onto digital atlases [3]. The NeuARt subsystem exploits KEfED representations to allow the access of atlas-registered data supporting high-level connectivity assertions.
[1] Burns, G. A. P. C., & Russ, T. A. (2009). Biomedical knowledge engineering tools based on experimental design: a case study based on neuroanatomical tract-tracing experiments. KCAP 2009 (p. 173–174). ACM.
[2] Ramakrishnan, C., JR, W. A. B., Blake, J., Burns, G. A. P. C., Cohen, K. B., Drabkin, H., Eppig, J., et al. (2010). Building the Scientific Knowledge Mine (SciKnowMine): a community-driven framework for text mining tools in direct service to biocuration. Information Sciences.
[3] Burns, G. A., Cheng, W.-C., Thompson, R. H., & Swanson, L. W. (2006). The NeuARt II system: a viewing tool for neuroanatomical data based on published neuroanatomical atlases. BMC Bioinformatics, 7, 531. BioMed Central.


 Latest news for Neuroinformatics 2011
 Follow INCF on Twitter
