SVM-supported analysis of brain connectivity networks
Manuel André Gaudnek (Institute for Pharmacology, FAU Erlangen), Greg Neely (IMBA, Vienna/Neurosc. Prog., Garvan IMR), Josef Penninger (IMBA, Vienna), Andreas Hess (Institute for Pharmacology, FAU Erlangen)
Analysis of functional brain connectivity via graph theory has become an established tool in the neuroscientific community. One new use case is the evaluation of functional connectivity of genetically modified mice. Within this abstract differential analysis between wild type (WT) and α2δ3 knockout mice [1] is exemplified.
We use functional Magnet Resonance Imaging (fMRI) to acquire blood oxygenation level dependant signals after thermal stimulation of hind paws. After labeling the activated brain regions using an aligned digital atlas, the correlation between the mean time signal courses of all regions can be calculated resulting in a symmetric correlation matrix. Such a matrix can also be interpreted as an adjacency matrix of a graph (node: brain region, edge: correlation between the two regions it is connected to).
Averaging the animal and brain region specific correlation values for the WT and KO group allows to identify group specific strong connections between brain regions as well as large changes in their connectivity. However, only inspecting averaged correlations hides the distribution of the correlation values. Whether apparent differences between both groups are caused by actually shifted correlations or just by large variance has to be checked subsequently. On the other hand small differences between mean values are easily missed, even if they are relevant due to small variances.
The above mentioned problems can be overcome with a support vector machine (SVM). The correlation matrix of each animal represents one data point in a high-dimensional space, labeled either with WT or KO. The purpose of an SVM is to find a hyperplane in this space which separates it into halves, each containing data points of one group only. Additionally the plane shall have a large margin, i.e. be as far away from all data points as possible. The perpendicular to this plane is the direction of best separation and used as an indicator for the best separating components. Advantageously the SVM does not use mean values nor is it dependant on any specific distribution of the data points.
The SVM method is also applicable to other input vectors than the correlation matrix. E.g. we calculate the graph theoretical strength of each brain region node, i.e. sum of all its correlations connected, resulting in one strength vector of all brain regions for each animal. The SVM method then finds brain regions instead of connections between regions that are relevant for a separation of the WT and KO groups.
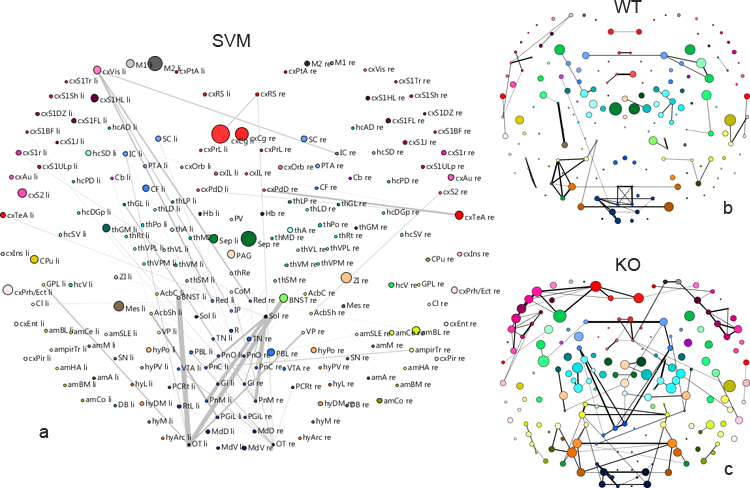
The figure shows graph representations of the mouse brain. The SVM differential analysis results (a) reproduced some differences between WT an KO mice which are also visible by inspecting conventional graph representations of mean correlation matrices of WT (b) and KO (c), like the strong connectivity changes in sensory input regions (low middle region) or different septum activity (green center nodes). On the other hand the SVM points out differences which are less or not prominent in (b) and (c), e.g. cingulate cortex activity differences (red upper center nodes) or different connectivity of left visual cortex (magenta upper left node).
[1] G. Neely, A. Hess, Michael Costigan et al., A Genome-wide Drosophila Screen for Heat Nociception Identifies α2δ3 as an Evolutionarily Conserved Pain Gene, Cell, 2010, 143(4):628-638


 Latest news for Neuroinformatics 2011
 Follow INCF on Twitter
