The connectome of the rat central nervous system in neuroVIISAS
Oliver Schmitt (Dep. of Anatomy, University of Rostock), Peter Eipert (Dep. of Anatomy, University of Rostock), Andreas Wree (Dep. of Anatomy, University of Rostock), Klaus-Peter Schmitz (Dep. of Biomedical Engeneering, University of Rostock)
Background. Most tracing studies have been performed in the rat central nervous system. However, an integrative approach to analyze and compare these tracing data on all levels of the rat central nervous system is not available. The generic platform neuroVIISAS allows to integrate neuroontological, atlas, visualization, connectivity analysis and population based simulations techniques for all types of nervous systems.
Material. In
an ongoing metastudy 830 tracing publications have been evaluated
with regard to ipsi-, contralateral connections, projection
densities, projection directions and neurochemical features. 56000
conenctions of the rat central nervous system are available in
neuroVIISAS.
The connectivity data are related to 8400 neuroanatomic regions that
are organized hierarchically. The topographic relations between
regions are defined by ontological relations like e.g. „part_of“.
The regions are mapped to a high resolution affine linear and elastic
registered histological dataset with an isotropic resolution of 5 x 5
x 5 µm³ and
to the atlas dataset of the Paxinos and Watson stereotactic rat brain
atlas (2007).
Methods. neuroVIISAS has been developed in JAVA (Java Development Kit (JDK)) and is running on 32 and 64 Bit Windows and Linux systems. The Visualization Toolkit (VTK) is used for 3D-visualization of brain region surfaces within neuroVIISAS. VTK consists of a C++ class library that is accessed via a JAVAwrapper. Further packages are InfoNode Docking Windows (v1.5), which is a JAVA Swing based docking windows framework and the icon library Fugue Icons (v2.0). Furthermore, Python, PyNEST and NEST are necessary to generate simulation scripts under neuroVIISAS and for performing the simulation in a Linux environment.
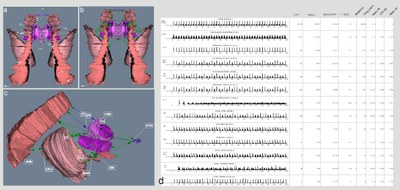
Result. The connectome of the rat nervous system has features of a scale-free Watts-Strogatz network. The average cluster coefficient is 0.112 and the avergae path length is 4.844. The average valency is 8.975 and the centrality is 0.081. Motif-analysis of 3 node directed motifs showed significant frequencies for divergent, convergent and reciprocal motifs. The lateral hypothalamic area possesses largest in- and outdegrees. We will present results of local connectivity analysis, e.g., cluster coefficient, eigenvector centrality, Shapley values, modularity analysis and communicability features of the connectome components. Based on these parameters the extrapyramidal system has been selected and visualized for an examplary simulation based on real neuroanatomic connectivity (Fig. 1).
Outlook. neuroVIISAS integrates basic components of neuroinformatic techniques like neuroontological data structures, attributes, hierarchies, mapping/atlasing, multimodal data integration (histology, atlas, MRI datasets), connectivity analysis, multidimensional visualization, simulation definition/control/analysis/visualization in a generic platform in combination with the largest connectivity database. Currently tools are under development that allows to match tractographic data with connectivity data to compute precise spatial pathways. Multiscale techniques for visualization, connectivity filtering and simulation analysis are of particular interest to understand effects of scaling within simulations. Finally, multicompartment models of neurons for more specific local circuit definitions are under development in order to simulate complex functions like motor control by extrapyramidal and cerebellar subsystems.


 Latest news for Neuroinformatics 2011
 Follow INCF on Twitter
